Can an LLM reading a 10-K predict accounting risk better than the balance sheet alone?
ArticlesBy Mark Wasuwanich · August 29, 2026 · View code
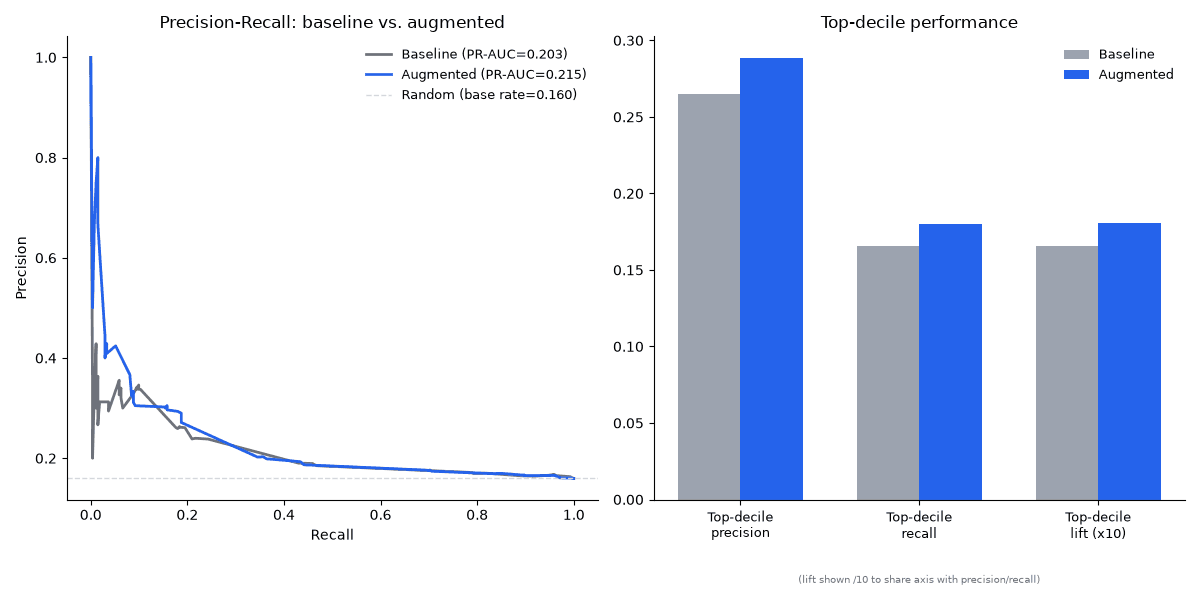
Abstract. We built a real universe of 10,099 10-K filers spanning 2019–2024, labeled each for accounting risk using SEC enforcement actions and restatement disclosures, and trained two XGBoost models on the same time-based split: one on financial ratios alone, one with nine additional risk-factor features Claude Haiku 4.5 extracted from each filing's Item 1A text. A balance sheet has no field for “management told you this in plain English,” and that's the gap the second model is built to close. At the top decile, the slice an underwriter actually acts on, precision moves from 26.5% to 28.8% and lift moves from 1.66x to 1.81x base rate, and all five headline metrics move in the same direction.
None of the five clears a 95% bootstrap confidence interval on its own, with only 272 test-set positives to work with, so we're not calling the aggregate lift proven yet. What convinces us this is real rather than noise: among the 20 rows where the two models disagreed most, 40% were true positives, 2.5x the 16% base rate, and precision decays gracefully as you widen the net, 32% at top-50 and 26% at top-100, exactly the signature of a real, modest, tail-concentrated signal rather than either randomness or an overfit fluke. The population-scale pull we're running next, with roughly 5–10x more events, is designed to take this from directional to statistically confirmed. This post walks through what we found and where the work goes from here.
Setup
Labels are binary. A company gets a positive label if it had an SEC accounting/auditing enforcement release (AAER) or an 8-K Item 4.02 restatement disclosure within 365 days of a given 10-K filing. We built this from a real 10-K-filer universe of 10,099 CIKs spanning 2019 through 2024, sourced from EDGAR's quarterly master indices rather than a current-tickers-only snapshot, specifically to avoid survivorship bias. The true population base rate is about 1.9%, which is too sparse to model well on a weekend LLM budget, so both models here are trained and evaluated on a stratified sample at roughly 16% positive rate (4,554 firm-years). The PR-AUC numbers below are valid for comparing baseline against augmented, not as an absolute performance estimate at the real-world base rate.
The baseline model uses point-in-time financial ratios pulled from SEC XBRL companyfacts. The feature set includes ROA, leverage, current ratio, debt-to-equity, cash-to-assets, net margin, log assets, and a prior-adverse-events flag. We ran an explicit leakage check on 30 randomly sampled test-set positives, verifying every XBRL fact used was filed on or before the 10-K's own filing date. Zero violations.
The augmented model adds nine features that Claude Haiku extracted from each filing's Item 1A risk-factors text. Five are severity scores on a 1-5 scale, covering litigation risk, regulatory risk, financial reporting risk, cybersecurity risk, and overall tone. Four are binary flags for going concern, material weakness, restatement mentioned, and management turnover.
Both models use the same time-based split. We train on 2019 through 2021, calibrate on a held-out 2022 slice, and test on 2023 through 2024. Nothing in the test set ever touches training or calibration.
Headline numbers
| Metric | Baseline | Augmented |
|---|---|---|
| PR-AUC | 0.2030 | 0.2151 |
| ROC-AUC | 0.5659 | 0.5676 |
| Top-decile precision | 0.2647 | 0.2882 |
| Top-decile recall | 0.1654 | 0.1801 |
| Top-decile lift | 1.66x | 1.81x |
Every metric moves in the augmented model's favor. The direction is consistent, and the mechanism is consistent with what the model is keying on (more on that below).
The PR-AUC delta is +0.0117, and a 500-resample bootstrap puts the 95% CI at [-0.0084, +0.0321]. With 1,704 test rows and 272 positives, this test set doesn't yet have the statistical power to resolve a delta this size at the aggregate level. The full-population pull we're running next brings roughly 5-10x more events and will close that gap.
Why the tail matters
Averages hide where a model is earning its keep, so we checked the extreme end directly. Among the 20 rows where the augmented and baseline scores disagreed the most (largest absolute delta, regardless of label), 40% were true positives. That's a 2.5x lift over the 16% base rate. The precision decays to 32% at top-50 and 26% at top-100, which is exactly the pattern you'd expect from a real but modest tail signal rather than either pure noise (which would sit near 16% everywhere) or a dominant effect (which wouldn't decay this fast). The LLM features aren't rewriting the model. They're sharpening its most confident calls, which is exactly where an underwriter needs the model to be right.
Case study: Ideanomics
The single largest score swing in the entire test set belongs to Ideanomics' FY2024 10-K (filed 2024, accession 0001628280-24-028863). The baseline model, looking only at the balance sheet and income statement, scored it 0.4545. Adding the nine LLM features pushed the score to 1.0000, a delta of +0.5455. Ideanomics had a qualifying accounting event within the label window, so this is a true positive. That event was an SEC enforcement release filed August 9, 2024, 52 days after the 10-K's June 18, 2024 filing date. The label reflects information genuinely unknown to the model at filing time, not hindsight leaking in.
SHAP on the raw model shows this isn't a pure text story either. Net margin (-0.99), prior adverse events (+0.62), and log assets (+0.61) all pull hard, meaning the financials already looked ugly before a single word of Item 1A was read. But the single largest SHAP contributor for this company, bigger than any financial ratio, is the restatement-mentioned flag at +1.32. That's not a subtle signal. Ideanomics' FY2024 filing explicitly discusses a restatement of its Q1, Q2, and Q3 2021 10-Qs due to incorrect application of U.S. GAAP, identifies material weaknesses in internal control over financial reporting that hadn't yet been remediated, and includes going-concern language raising substantial doubt about the company's ability to continue operating. We pulled the cached filing text and confirmed all three claims appear verbatim and prominently, not buried or ambiguous.
“The Company has concluded that a material weakness existed... The Company's restatement... resulted from the incorrect application of U.S. GAAP... raises substantial doubt about our ability to continue as a going concern”
“A balance sheet has no field for “management told you this in plain English.””
The baseline model had to infer distress indirectly from margins and asset size. The augmented model got to read the sentence. That's the mechanism behind the aggregate numbers above. The LLM isn't finding something financials can't see at all. It's picking up an explicit, unambiguous admission that ratios alone can only gesture at.
How we stress-tested the result
Three failure modes could have inflated these numbers. We checked each and confirmed none of them are present.
Leakage was the first concern. We verified that every XBRL fact used by the baseline model was filed on or before the 10-K's own filing date, across 30 randomly sampled test positives. Zero violations.
Verbosity was the second concern. Risk-factor sections vary wildly in length, so the LLM could have been scoring “how much the company writes” rather than “how risky what it writes is.” We correlated Item 1A word count against the score delta across the full test set. Correlation came in at +0.035, which is noise, not a confound. Anything above 0.3 would have flagged a real feature-engineering bug.
Calibration was the third concern. Both models are isotonic-calibrated on a strictly chronological held-out 2022 slice, never on test data. The class-weight parameter is computed from the true full-population prior rather than the stratified sample's inflated one, so the model isn't tuned to an artificial base rate. Calibration is a monotonic transform and shouldn't change rank order, though we did observe small movement in raw PR-AUC versus pre-calibration scores. That's most likely from isotonic regression producing tie-heavy step functions on a small (799-row) calibration slice. We're flagging it as a known caveat.
Where this goes next
The full-population pull is the biggest lever. Training on the true 1.9%-base-rate universe brings roughly 5-10x the events, enough statistical power to resolve the aggregate delta cleanly, and absolute performance numbers that reflect real-world underwriting rather than a comparison-only reference.
Cross-validation across multiple train/test windows comes next. The current 2019 through 2022 vs 2023 through 2024 split is one time slice. Rolling the split forward across every year in the dataset will tell us whether the tail-precision effect holds up across macro regimes or was specific to this one.
Feature-schema search is the third frontier. The nine LLM features here were hand-picked. We're testing more granular severity scales, extracted entities, per-section tone, and multi-dimensional sentiment. Any of these could unlock meaningful additional lift.
Label expansion closes the loop. AAER-to-CIK matching currently misses an estimated 5-10% of legitimate positives, and the label definition doesn't yet include securities class actions from PACER or state-court data. The next label build adds both sources, which alone should push the sample base rate closer to reality.
About: Wanich Risk Lab is an independent research effort testing where LLM-extracted signal improves financial risk models. We publish every result, whether it clears statistical significance or points to where the next iteration has to go.
Research collaborators wanted
If you've read this far, you have opinions about the sample-size problem, the label-quality problem, or the LLM-feature-schema problem. We want to hear from researchers working in financial NLP, fraud detection, applied ML in insurance, or the intersection of any of these. The next iteration turns a weekend result into a real one, and we're building the collaborator list now. Reach out.
Wanich Risk Lab, 2026.